Latest Articles
Expert insights on data visualization, dashboard design, and analytics.

Generative AI and Data Visualization: Where Automation Meets Governance
Generative AI promises to democratize data visualization. But how do you ensure data quality, ethics, and compliance in the face of algorithmic bias and sensitive data handling?

From Firebase to PostgreSQL: How We Cut Our Cloud Costs by 80%
A retrospective on a complex Firebase to PostgreSQL migration that transformed our data architecture and cut our cloud bill by 80%.

Why So Many Teams Are Replacing Metabase with Open Source DuckDB
Dashboards that take 30 seconds to load, queries that time out: many organizations are hitting Metabase's scaling limits and turning to DuckDB.

AI-Generated Images Won't Replace Your Professional Designers (And That's a Good Thing)
Between technological fascination and real-world constraints, where should you draw the line when looking to unlock value from your data with AI? A closer look at what AI imagery can—and can't—deliver.

dbt Fusion: How to Cut Data Warehouse Compute Costs by 64%
State-aware orchestration transforms data pipeline management: fewer wasted computations, faster deployments, massive savings on your compute costs.

Why Your PostgreSQL JSONB Queries Are Slow, and How to Speed Them Up with GIN Indexes
Your JSON data in PostgreSQL running slow? The problem rarely stems from volume. Here's how to diagnose and optimize your JSONB queries with GIN indexes for dramatic performance gains.

Why Your Data Walls End Up in a Drawer (And How to Avoid It)
Data walls rarely fail for technical reasons. It's people who make the difference between a dashboard gathering dust and a tool that drives transformation.

Strongly Typed PostgreSQL Queries: How pg-typesafe Eliminates SQL Errors in Production
SQL errors in production are expensive. pg-typesafe brings TypeScript's strong typing to your PostgreSQL queries so you can catch them before deployment.

When Data Delivers Business Results: Decoding the Signals That Matter
Between promises and real-world results, how to identify true performance indicators for a data strategy and set realistic timelines to measure business intelligence impact.

Reducing Snowflake Costs by 64%: The Practical Guide to dbt's Fusion Engine
dbt's Fusion engine transforms the economics of modern data warehouses. Here's how an optimization that changes the game delivered a -64% reduction in compute costs.

When Each Team Has Its Own Truth: Why the Semantic Layer Is a Game Changer
Conflicting metrics are costing organizations dearly. The semantic layer finally provides a structural solution to this endemic data governance challenge.

How to Actually Evaluate Your AI Agents on Data Tasks
Between marketing promises and real-world performance, measuring an AI agent's effectiveness on your data requires a rigorous methodology.

How to Measure Data Project ROI: Beyond Metrics, a Matter of Strategic Vision
Measuring the ROI of a data project goes far beyond a simple cost-to-benefit ratio. It's a strategic exercise that reveals your organization's data maturity and guides investment decisions.

How to Mitigate Financial Risks with Predictive Business Intelligence
How Predictive Models Transform Financial Risk Management into Strategic Anticipation Rather Than Reactive Firefighting: Fraud, Credit, and Obsolescence.

How to Cut Your Compute Costs by 60% Without Compromising Your Data Pipeline
Your cloud bill is skyrocketing, execution times are dragging. What if the issue stemmed from how you're orchestrating your dbt transformations?

Choosing a Data Agency: Beyond the Hype, What Actually Matters
Between technical expertise and business acumen, how do you identify the agency that will truly turn your data into a strategic asset? Here's what to look for when choosing a data agency.

Why Your AI Agents Are Crashing and Burning (And How a Semantic Layer Can Save Them)
AI agents are everywhere now. But without a semantic layer, it's like throwing interns into your IT infrastructure without a briefing. Discover why the semantic layer is the key to AI governance.

The Future of Data Careers: Less Code, More Meaning for Analysts
Explore how the future of data careers is shifting from pure technical skills to a focus on meaning and analysis. Learn how AI is transforming the field and how data analysts can adapt.

Discover the Best Free & Open-Source Data Visualization Tools in 2025
Discover the best free and open-source data visualization tools in 2025, from Streamlit to Tableau, and how AI is reshaping dashboards to deliver actionable insights.

10h11's Bold Return to Red: Embracing Brand Essentials
10h11 is embracing its original bold, red visual identity after years of experimentation. This strategic move back to the brand's core essentials is designed to grab attention and embody the fighting spirit of the young data-driven team.

Unleash Sports Performance with TEAM SPORTS App: Data-Driven Success
Gain a strategic advantage with the TEAM SPORTS App's unique combination of social psychology, neuroscience, and motor learning. Optimize your team's collective dynamics through advanced psychometric analysis.

Unlock the Future of Crypto Mining with 10h11 x ForMining Space Partnership
Explore the 10h11 and ForMining Space partnership, rethinking the future of crypto mining through data-driven innovation. Unlock a fluid, secure, and efficient mining platform backed by blockchain technology.

Streamlining Business Insights: Powerful Data Visualization with Streamlit and AI
Leverage Streamlit and AI to transform raw business data into compelling visualizations and interactive applications. Unlock actionable insights to drive informed decision-making.

Innovative 10h11 Collaboration for TANGRAM's Social Room Dashboards
10h11 and TANGRAM's innovative collaboration brings dynamic dashboards to the Social Room at the new TANGRAM Center of Excellence, transforming digital experiences.

Revolutionizing Knowledge Management with RAG: The AI-Powered Innovation
Artificial intelligence has undergone an impressive transformation, thanks to Large Language Models (LLMs) that enable new applications in natural language processing. The innovative Generation Augmented by Research (RAG) approach integrates information retrieval to access external knowledge and enhance AI-assisted text generation.

Revolutionize Data Analytics with Multimodal AI: Gpt-4o's Transformative Power
Explore the transformative potential of Gpt-4o, OpenAI's multimodal AI model that can simultaneously process text, images, and voice for revolutionized data analysis and business intelligence.

Strategies to Develop GDPR-Compliant AI: Insights from the CNIL
Explore the dynamic relationship between GDPR and AI, and learn how to ensure technological progress aligns with people's rights. Get insights from the CNIL on the real challenge of personal data management.

Empower Your Business Decisions with Self-Service Analytics
Unlock the power of self-service analytics and transform your decision-making process. Learn how easy-to-use tools are democratizing data access and driving smarter business insights.

How No-Code Tools Are Democratizing Data Analysis for All Employees
No-code tools are ushering in a new era of data democratization, where all employees can become data analysts. Learn how this shift is transforming the way organizations leverage data insights.

The 5 Main Types of Dashboards to Empower Your Data-Driven Decision Making
Welcome to the fascinating world of dashboards, where data never sleeps and decisions are king. Explore the 5 main types of dashboards that can empower your data-driven decision making.

Streamline Your Business with PocketBoard: WhatsApp Integration for Data Access
Chasing lost moments? 10h11's PocketBoard solution brings your business data directly into WhatsApp, keeping you informed and productive on the go.
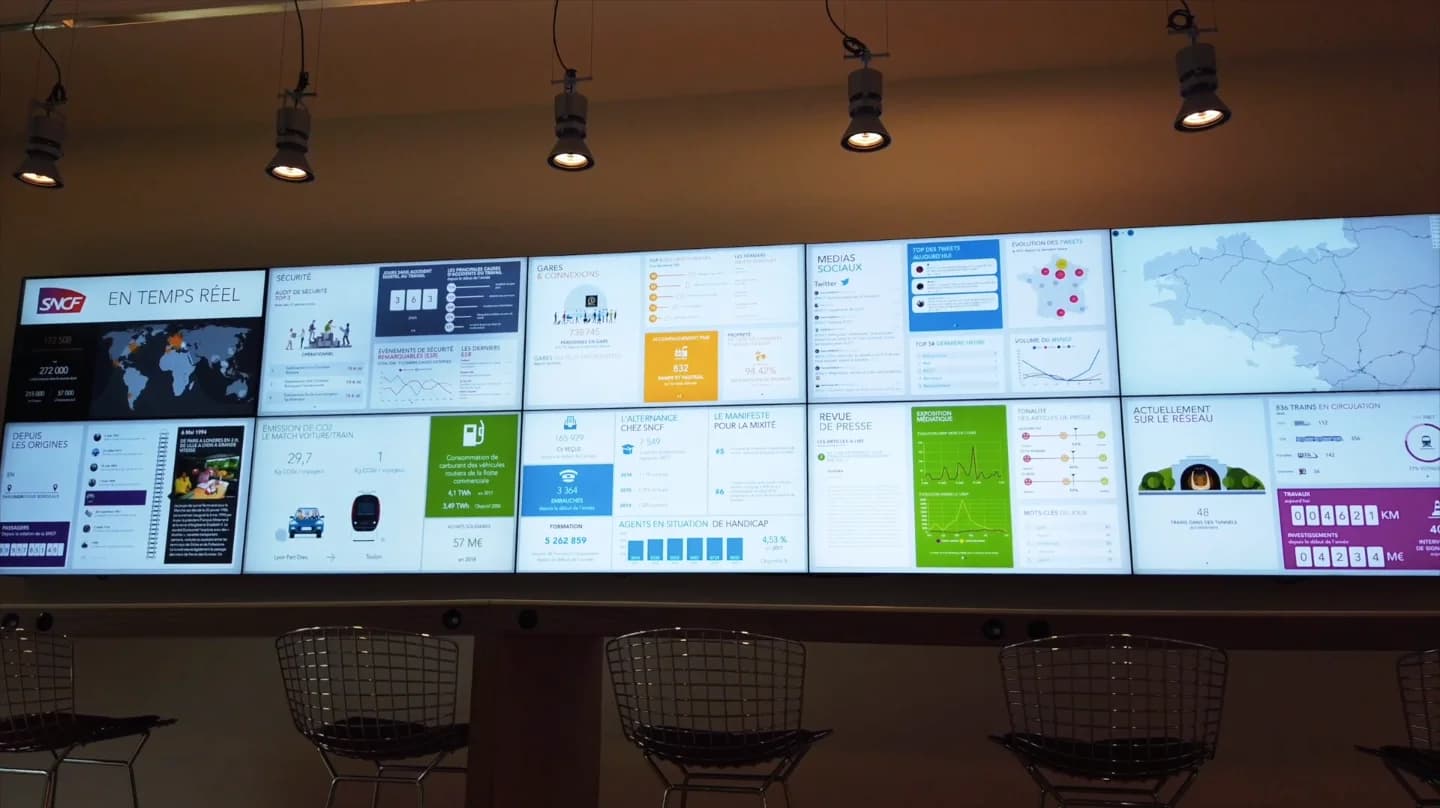
10h11 Designs Massive Dashboard for Improved SNCF Transparency
10h11 designed the largest dashboard in Europe for SNCF, featuring 10 giant screens displaying real-time data from over 100 datasets to improve transparency and communication.

Optimizing Air Quality for Employee Health & Productivity
Explore the importance of office air quality and its profound effects on employee health, well-being, and productivity. Uncover data-driven solutions to create a healthier work environment.

Discover the Role of a Data Owner in Your Business | 10h11
Identifying a Data Owner, even part-time, is crucial for maintaining data inventory, combining data access, and establishing a data dictionary. Discover the valuable benefits of having this role in your company.

Uncover the Hottest Data Science Trends Transforming Industries
Explore the latest data science trends fueling digital transformation across industries. Uncover the innovative technologies and strategies shaping the future of data-driven decision making.

Moving from Excel to Intelligent Tools: Transforming Standardization to Industrialization
Letting go of old habits can be challenging, but embracing intelligent tools can transform standardization into industrialization. Explore how to move from Excel-based processes to innovative solutions that enhance efficiency and productivity.

Unleash Team Productivity: Harness Data-Driven Team Management
10h11 does not just exploit data and innovative interfaces for its clients - the agency's internal operations are also driven by data-powered team management. Unlock the secrets to boosting team productivity and achieving your organization's goals.

GDPR Compliance for Remote Work: 5 Essential Tips for Secure Teleworking
Teleworking has surged, but businesses must ensure GDPR compliance. Discover 5 crucial tips to secure remote work and protect personal data according to the GDPR.

7 Key Questions to Ask Before Building Your Dashboard | 10h11
Building a dashboard can be time-consuming. Ask these 7 essential questions to focus on the most important KPIs and data for your short-term business needs.

Unleash Your Data's Potential: Top Open Source Visualization Tools | 10h11
Explore the top open source data visualization tools for businesses of all sizes. Learn how to create engaging graphics, customize solutions, and unlock the full potential of your data.

The value of dark data: everything you need to know
Businesses today are awash in data, but not all of that data is created equal. Data that cannot be analyzed or that is locked in unconnected systems is known as "dark data." They have value when they can be analyzed and used.

Top Languages for Data Analysis: R vs Python | 10h11
There are several computer languages that allow you to conduct exploratory data analyses. The two most popular options are R and Python, each with unique strengths for data science projects.

Upgrade from Excel to Powerful Data Management Tool | 10h11
Many businesses struggle with Excel-based processes that lack industrialization and data integration. Discover how to upgrade to a powerful data management tool and boost your efficiency.